Comprehensive climate data visualization and analysis for Afghanistan, Pakistan, and India. Tracking temperature, precipitation, atmospheric changes, and environmental transformations from 1960 to present.
Researcher Perspectives: Climate change represents long-term shifts in temperatures and weather patterns, primarily caused by human activities, especially the burning of fossil fuels (coal, oil, and gas), which produces heat-trapping greenhouse gases.
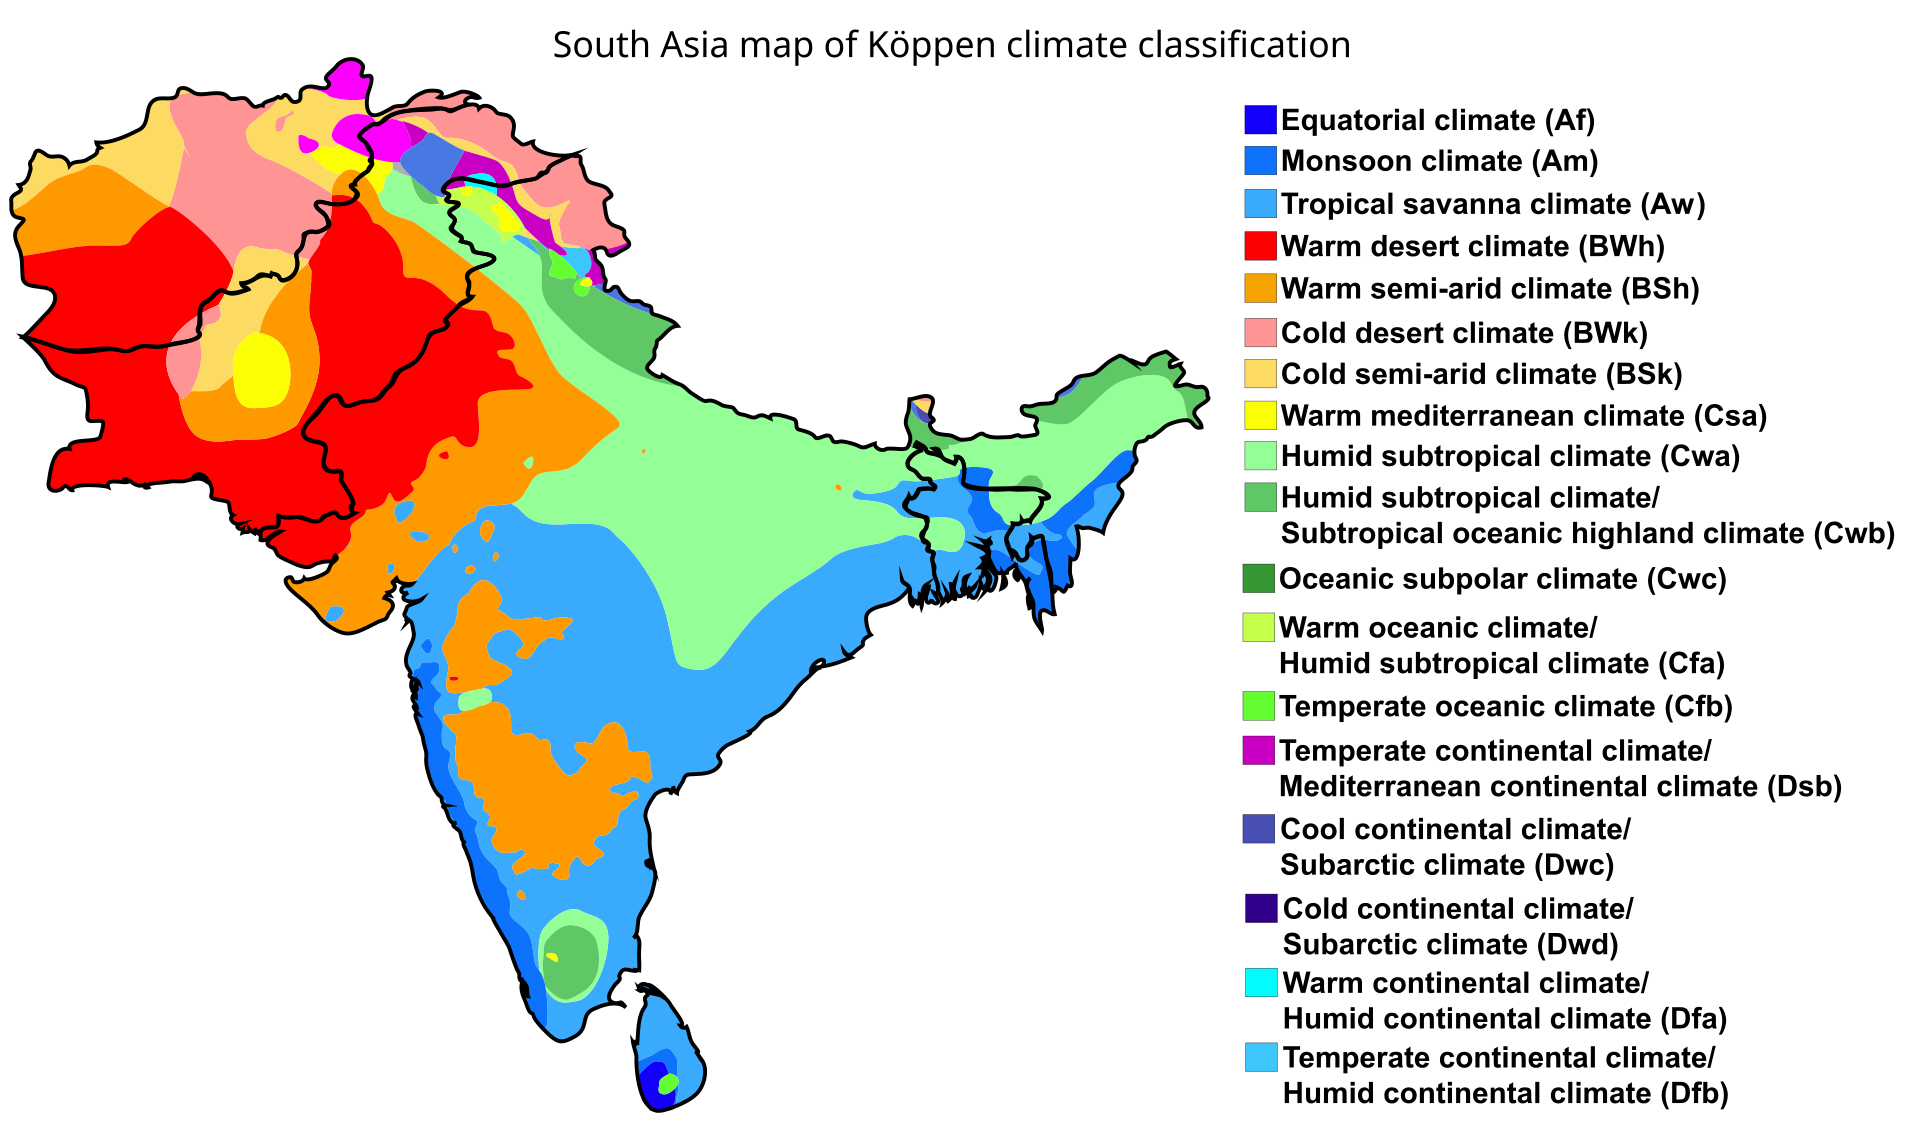
South Asia, home to over 1.8 billion people, is one of the most vulnerable regions to climate change impacts, facing rising temperatures, changing monsoon patterns, glacial melt, sea-level rise, and increased frequency of extreme weather events.
Climate Data and Environmental Indicators | 1960-2024
Average temperature increase since 1960. Warming rate exceeds global average, particularly in northern and central highlands.
Rising TrendOverall decrease in annual precipitation. Increased variability with more intense rainfall events and longer dry periods.
DecreasingCOβ concentration levels. Methane emissions from agriculture and livestock contributing to greenhouse effect.
IncreasingGlacier mass loss in Hindu Kush mountains. Snow cover duration reduced by 2-3 weeks over past 40 years.
Rapid MeltReduction in water availability per capita. Groundwater depletion and reduced river flows from glacier melt.
CriticalMaximum temperatures during heatwaves. Frequency increased 3x since 1980, particularly in southern regions.
More FrequentClimate Data and Environmental Indicators | 1960-2024
Average temperature rise since 1960. Urban heat islands in Karachi and Lahore showing +2.5Β°C increases.
RisingOverall increase but highly erratic. Monsoon intensity up 25%, causing severe flooding events.
VariableCOβ levels rising. Industrial emissions and vehicle pollution contributing to urban air quality crisis.
IncreasingGlacier retreat in Karakoram and Himalayas. Over 7,000 glaciers at risk, threatening Indus River system.
CriticalWater availability per capita dropped to critical levels. Among top 10 most water-stressed countries.
CriticalRecord temperatures in Sindh and Punjab. Heatwave duration extended by 3-4 weeks annually.
DeadlyClimate Data and Environmental Indicators | 1960-2024
Average temperature increase. Himalayan region warming 2x faster than global average.
RisingMonsoon rainfall increased but more erratic. Extreme rainfall events up 75% since 1950.
ErraticCOβ concentration. India is 3rd largest emitter globally. Air quality crisis in major cities.
HighHimalayan glaciers retreating rapidly. Gangotri glacier retreating 20-30m/year. Water security threat.
AlarminglyGroundwater depletion in Punjab, Haryana, Rajasthan. 21 cities to run out of groundwater by 2030.
CrisisHeatwave frequency up 8x since 1960. 2022 saw earliest and longest heatwave on record.
ExtremeComparative climate data visualization for South Asia (1960-2024)
Average temperature anomaly (Β°C) - Three Countries
Annual precipitation change (%) from baseline
Glacier mass loss (gigatons per year)
Water availability per capita (cubic meters)
Geopolitical and climate zones across Afghanistan, Pakistan, and India
π Region: South Asia | Population: 1.8+ Billion | Climate Vulnerability: Extreme
Open access platforms and databases for climate research
UN body assessing climate science. Provides comprehensive assessment reports on climate change impacts, adaptation, and mitigation. Primary source for global climate policy.
Visit IPCC βComprehensive guide to climate datasets, tools, and methodologies. Curated by NCAR and international partners.
Visit ResourceWorld Resources Institute platform tracking climate commitments, emissions, and progress toward Paris Agreement goals.
Visit ResourceUnited Nations greenhouse gas inventory data. National emissions reports and climate action tracking.
Visit ResourceInternational Monetary Fund climate macroeconomic data. Carbon pricing, climate finance, and economic impacts.
Visit ResourceClimate Change Knowledge Portal with country-specific data, projections, and vulnerability assessments.
Visit ResourceGovernment climate data portals for Afghanistan, Pakistan, and India. National communications and adaptation plans.
View PortalsHave climate data to contribute? Send us your research!